“The impact of COVID-19 on trips to urban amenities: Examining travel behavior changes in Somerville, MA”
PLOS One
Action Insights


Last Updated
Topic
Data and Evidence
Location
United States
How do you know if people’s preferences for amenities are changing? A study supported by the Bloomberg Harvard City Leadership Initiative shows how big data can help cities understand people’s travel behavior and respond accordingly.
Read the Action Insights below, or download as a PDF for use later.
Amenity clusters—main streets, business districts, and other commercial and cultural corridors—are the civic centers of community life. But as visitation preferences shift over time, what policy interventions can keep these locations relevant to residents? When it comes to understanding your city’s dynamic environment and the changing preferences of residents, our study suggests that big data1 can not only help city officials learn about their communities in real time but also with discovering where to exercise control, when to change tactics, and what the future may hold.
In 2020, SafeGraph, a firm that legally collected and sold anonymized GPS movement data from mobile apps in the US, offered its datasets free to non-profits and governmental agencies to help them address the COVID-19 pandemic. (SafeGraph no longer provides mobility data, but other companies continue to make it available for a fee.) These datasets provided information on which local businesses and main streets people visited and from which Census Block Group each trip originated.2 For our research, we used the roughly 81,000-person city of Somerville, Massachusetts as a use case.
We paired the SafeGraph visitation data with two other types: data from the municipality and from ESRI’s Business Analyst database. With this combination, we could describe the characteristics of each destination cluster: its size; business diversity; share of big-box stores versus small businesses; share of open green space and parking; and share of retail, food and beverage, and personal care stores. Connecting these various sources of data also allowed us to study how people’s destination preferences shifted monthly in a regular year (before COVID-19) and in the first calendar year of the pandemic.
By using the information in this way, we could estimate how a destination’s characteristics affected people’s choices. It also allowed us to study whether and how people’s preferences shifted during the pandemic—not only the number of trips they took, but also whether their preferences for different types of destinations changed, and if so, how? Were the shifts fleeting or longer lasting? We found the answers to be “yes” on both accounts.
Pre-pandemic, in April 2019, the roughly 350,000 trips logged indicated that people preferred areas with a diverse mix of businesses, larger store offerings, and open gathering spaces (e.g., parklets, public squares, tables, and benches). However, in April 2020, during the early phase of the pandemic—when non-essential businesses, such as apparel stores and personal care businesses were ordered to close and congregations of more than 10 people were prohibited—only 50,000 trips were taken, an 86% drop (Figure 1). We found that people were avoiding areas with larger gathering spaces, and business diversity no longer drove patronage decisions. In the early months of the pandemic, we also detected a significant change in where people chose to travel.
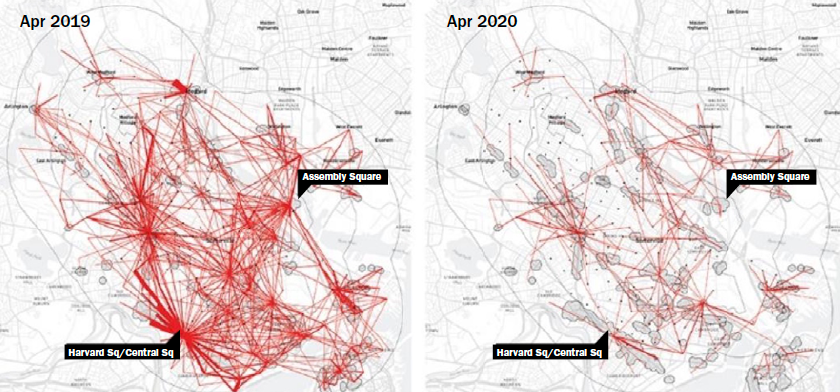
Figure 1 illustrates the distribution of trips from Census Block Groups to amenity clusters in and around Somerville, MA, in April 2019 (left) and April 2020 (right). (Trip originations are in the city or within 1 km. of the city; trip destinations are in the city or within 2 km. of the city.)
By fall 2020, the data showed that most people returned to their old preferences in terms of the types of venues or locales they were visiting, revealing that citizens’ preferences and habits are resilient. Yet one key new trend had also emerged: due to increased driving and more flexible work hours, people continued to be more willing to travel farther on their trips compared to pre-pandemic levels.
However, overall visitation numbers were still roughly 70% below pre-pandemic levels by the fall of 2020. Knowing why could help city leaders understand how to respond to business needs with policy tools and to plan for similar shocks in the future. Were city- and state-mandated business shutdown orders the primary reason for this change in behavior? Our study suggests they were only part of the reason. Combining historical data with newly formed destination preferences estimates from our model, we predicted that even if businesses had fully reopened by November 2020, the number of trips would still have been nearly 60% lower than pre-pandemic levels. More cautious consumer behavior appears to have played a bigger role in reduced business visits rather than business shut-down regulations.
Being able to monitor people’s travel behavior on a month-to-month basis with big, anonymous data can help city leaders understand how regulatory decisions can change visits to certain parts of their cities. Even outside of the pandemic, such data and models can provide valuable and timely insight into how people’s preferences for local centers shift over time, and which kinds of changes—in public space attributes, in the business mix or sizes, and in access characteristics—can most directly affect consumer behavior and local economic development. Ultimately, city hall could more clearly understand the preferences of its residents and local businesses and how to most effectively intervene to keep city streets vibrant.
The private sector routinely uses big data to understand consumer behavior changes and preferences. Our research demonstrates how city leaders might use it to make informed decisions about mobility, business regulation, and public health. Decisions about recreation, tourism and infrastructure, like drawing more people to public parks, promoting the use of public transportation, and anticipating the effects of zoning policies become easier and better informed when using big data. To be at the frontier of this practice in your city, consider the following:
Be curious.
Try to develop a better understanding of what residents are doing, where they’re doing it, and why they’re doing it. Ask questions, look for relevant data, and invite others to ask questions and challenge the status quo, too. Preferences may change by the week or year, but having a pulse on the behavior of residents in real time will help support more effective and dynamic decision making when it’s needed most.
Be creative.
While the expertise and resources to work with big data can be a barrier, creative, data-driven leaders can identify and leverage new opportunities to use big data to tackle problems. This could include partnering with a local university for expertise and capacity, requesting and allocating funding for data in planning projects or emergency relief, or finding accessible big data that is either public or free for non-commercial uses.
Be a connector.
While we connected SafeGraph, city, and business data, other types of datasets abound that are accessible and add value when combined with administrative data. Other examples include aerial imagery and survey data.
Though our study focused on behavior changes during a public health crisis, these concepts are applicable beyond a pandemic environment, especially when you’re looking to develop time-sensitive interventions or make long-term investment decisions based on residents’ behaviors.
1 Big data refers to large, expanding datasets that “require a scalable architecture for efficient storage, manipulation, and analysis.” (Source: National Institute of Standards and Technology, 2015)
2 These data do not represent all smartphone users in an area, only those that have enabled the GPS location feature in certain apps. Refer to the full academic article for limitations to the research.
PLOS One
Cities
Bloomberg Harvard City Leadership Initiative
Bloomberg Harvard City Leadership Initiative
Joint Center for Housing Studies of Harvard University
More Resources Like This