“Use of smartphone mobility data to analyze city park visits during the COVID-19 pandemic”
Landscape and Urban Planning
Action Insights


Last Updated
Topic
Data and Evidence
Location
United States
Just because parks are open to everyone doesn’t mean that residents can use them equally. But how do you determine who faces hidden barriers? A study supported by the Bloomberg Harvard City Leadership Initiative shows how city leaders can leverage big data to better understand and address inequities in access to public spaces.
Read the Action Insights below, or download as a PDF for use later.
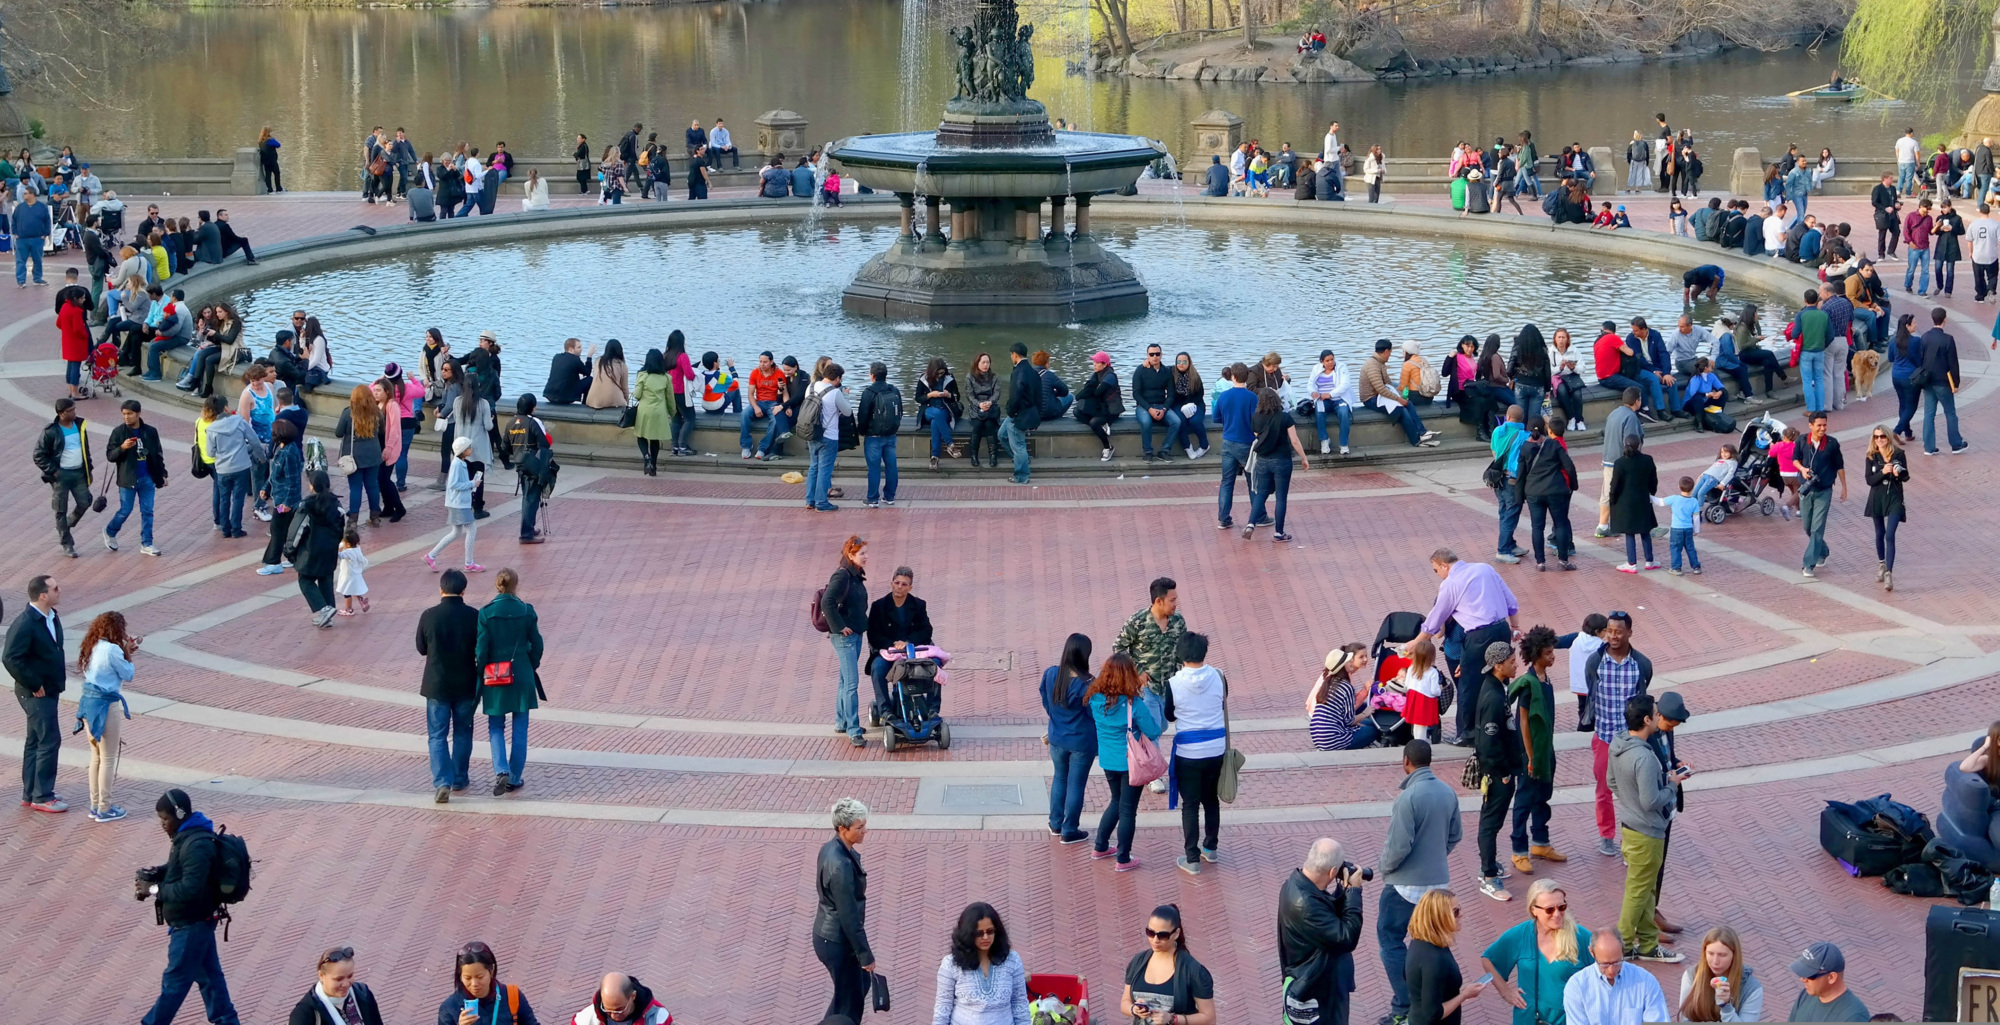
As COVID-19 restrictions lifted in the fall of 2020, city parks emerged as a literal breath of fresh air: a low-risk space to exercise and congregate with others, with potentially far-reaching benefits for physical and mental health. Even in normal times, however, parks and other public spaces like plazas, boardwalks, libraries, and beaches can play an important role in residents’ quality of life.
But how does your city determine who is making the most use of these resources and which communities might be facing hidden barriers? Assuming that proximity equals access—i.e., that residents of neighborhoods with the most public spaces use them the most—can lead to unreliable conclusions. And traditional approaches (such as conducting surveys or hiring workers to do real-time observation) rarely tell the full story, or are simply too difficult or costly to implement.
A study by the Bloomberg Harvard City Leadership Initiative, however, provides a promising path forward. The researchers used smartphone mobility data to analyze trends in city park visits during the COVID-19 pandemic. Beyond its implications for parks, the study serves as a proof of concept: it shows how city leaders can take full advantage of big datasets to better understand their communities— and leverage those insights to design more responsive, effective, and equitable policies for public spaces more broadly.
The research team set out to answer two questions: (1) Did the frequency of city park visits change during the pandemic? And (2) did those changes differ by neighborhood racial and economic composition? To test whether park use changed during COVID-19, they used information provided by SafeGraph, a company that legally collected, aggregated, and sold GPS location data from smartphone mobile apps. (SafeGraph no longer provides mobility data, but other companies currently make it available for a fee.) They then mapped this data onto Esri demographic information to understand the characteristics (race/ethnicity and household income) of communities living within a ten-minute or half-mile walk of each park.
The magnitude of the SafeGraph data—and the fact that the company offered it at no cost for academic and public interest research during the COVID-19 health emergency—gave the researchers an unprecedented advantage. They analyzed nearly twelve thousand parks across the fifty most populous US cities, equaling about 10 percent of the population and exceeding the geographic scope of any park use study available to the study authors. They found that, compared to pre-pandemic levels, park visits decreased by 43.3 percent during closures (March-April 2020) and 26.1 percent during the initial reopening (May-November 2020). In communities with a higher proportion of white and high-income residents, however, the reopening led to an 8.6 percent larger rebound in park visits.
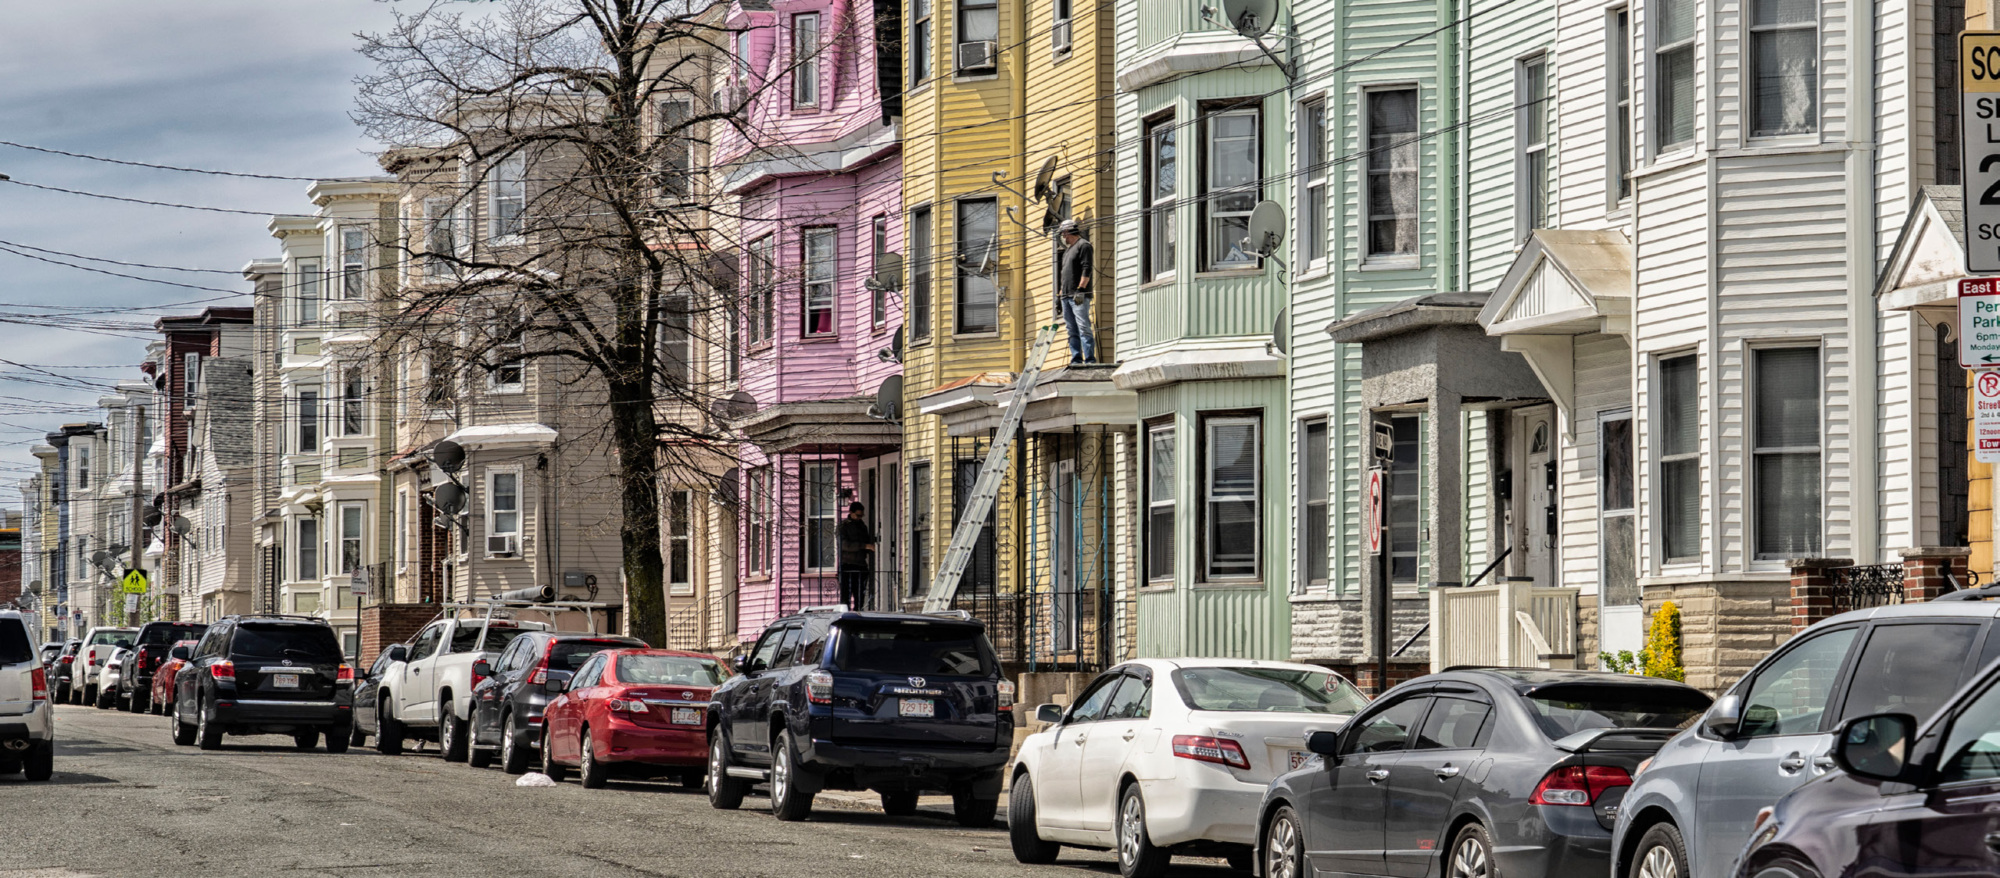
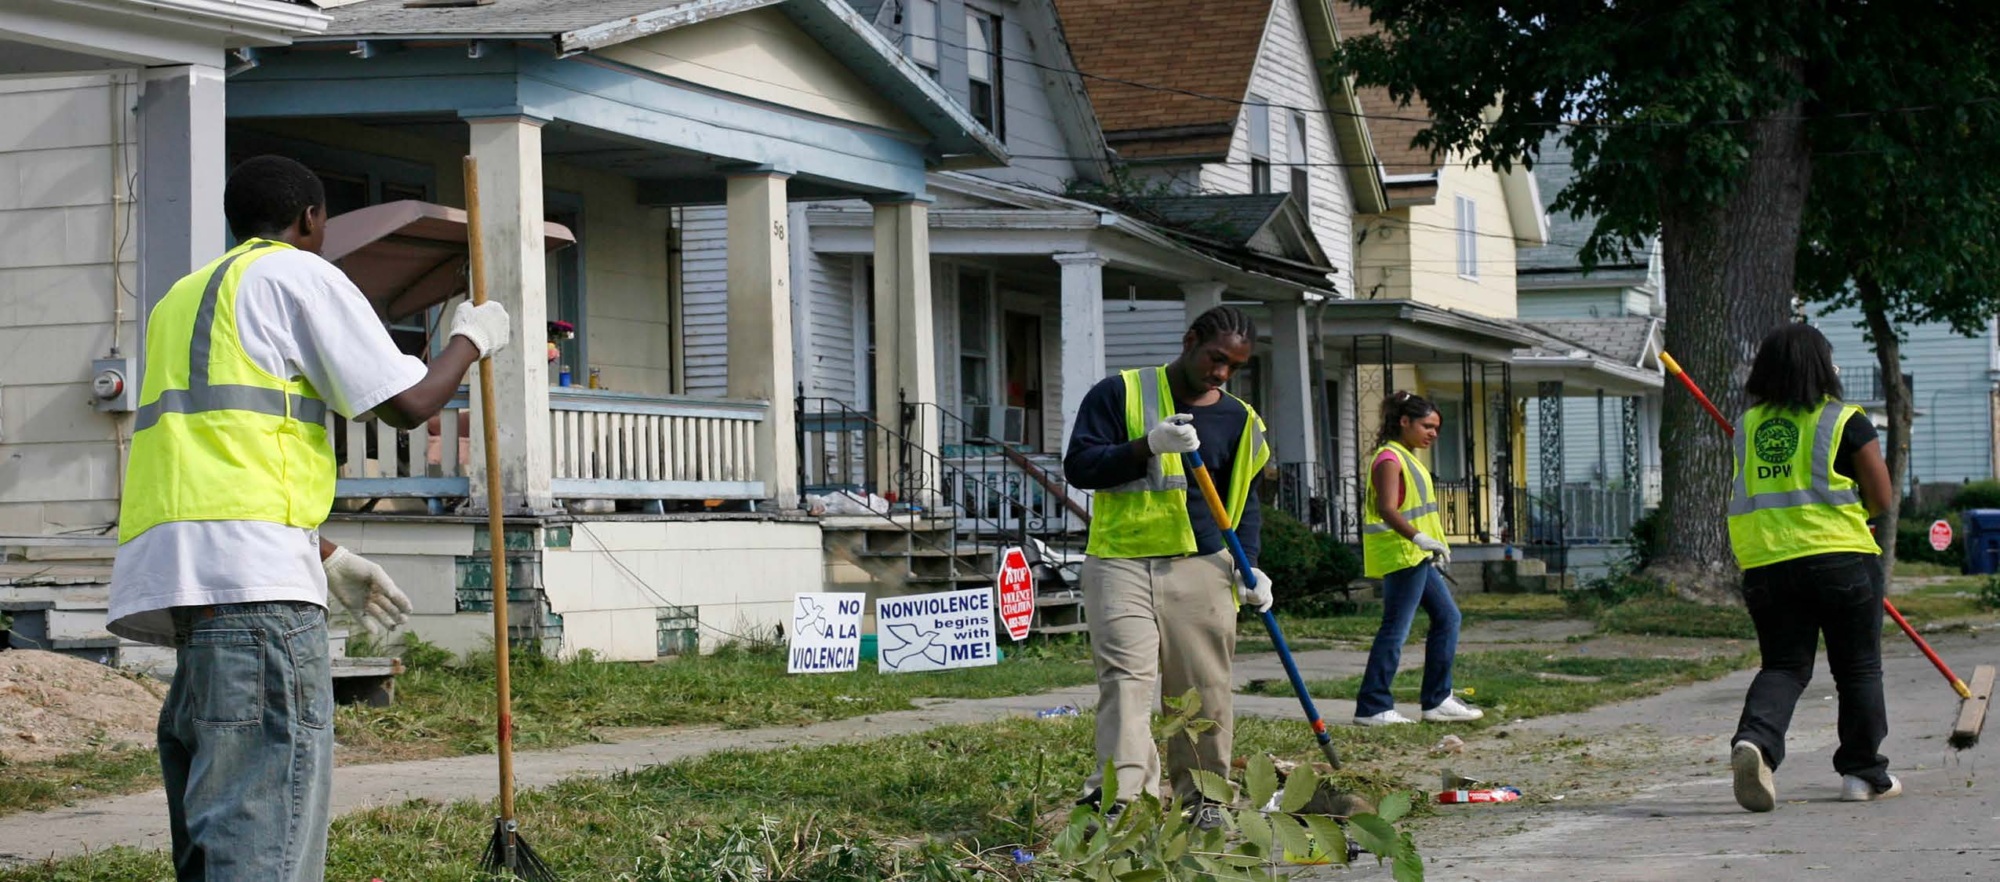
The study adds to existing evidence that racialized economic privilege shapes access to city parks, and that COVID-19 disproportionately burdened lower-income communities of color. The study also suggests that proximity is not always the greatest barrier keeping underprivileged city residents from using parks and other public spaces. Another set of obstacles may be at play, such as lack of leisure time, suitable programming, safe walking routes, and social support. These barriers likely increased during the pandemic, as lower-income workers were more often expected to show up to work, and community violence went up dramatically in racially segregated neighborhoods.
Big datasets, like the smartphone mobility data used in the study, can help city governments keep their finger on the pulse of what is going on in their communities and more quickly uncover hidden barriers in access to public spaces. Because these datasets are large, granular, and real-time, cities can get a deeper understanding of resident behavior, develop more targeted interventions to address inequities, and act faster if circumstances change. While this study focused on city parks, its approach can potentially serve cities facing a broad range of challenges—from understanding demographic trends in visits to healthcare facilities and libraries or the use of public transit, to determining the best locations to build low-income housing and public schools.
This article was written by Yamile Nesrala, Jonathan Jay, and Jorrit de Jong. The research team includes Jonathan Jay, Jorrit de Jong, Felicia Heykoop, Linda Hwang, Alexa Courtepatte, and Michelle Kondo.
Landscape and Urban Planning
Bloomberg Harvard City Leadership Initiative
Bloomberg Harvard City Leadership Initiative
Bloomberg Harvard City Leadership Initiative
More Resources Like This
Action Insights
Data and Evidence, Strategic Leadership and Management
Action Insights
Collaboration, Innovation
Case Epilogue
Collaboration